 English
 Chinese
info@dagyee.com
+8613961861780

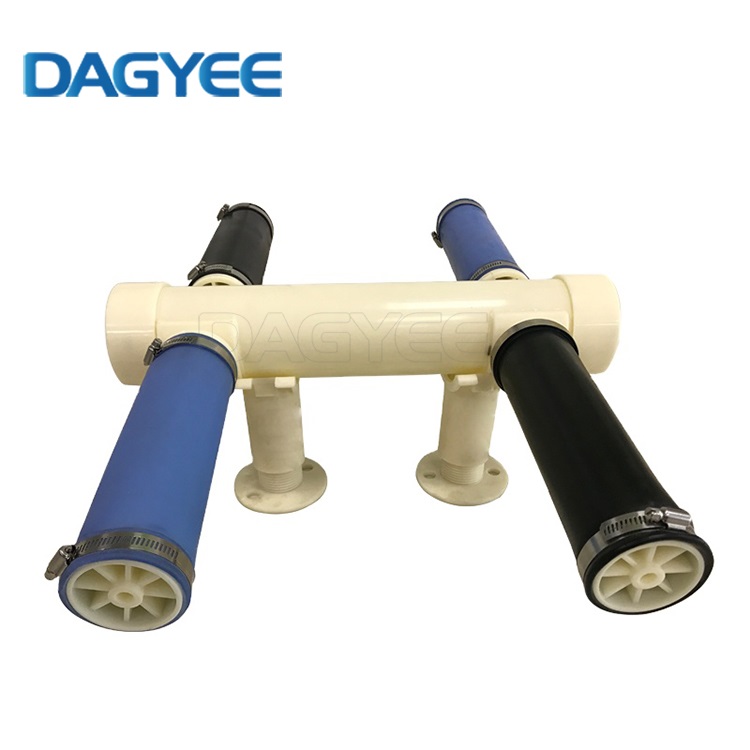
1. Introduction
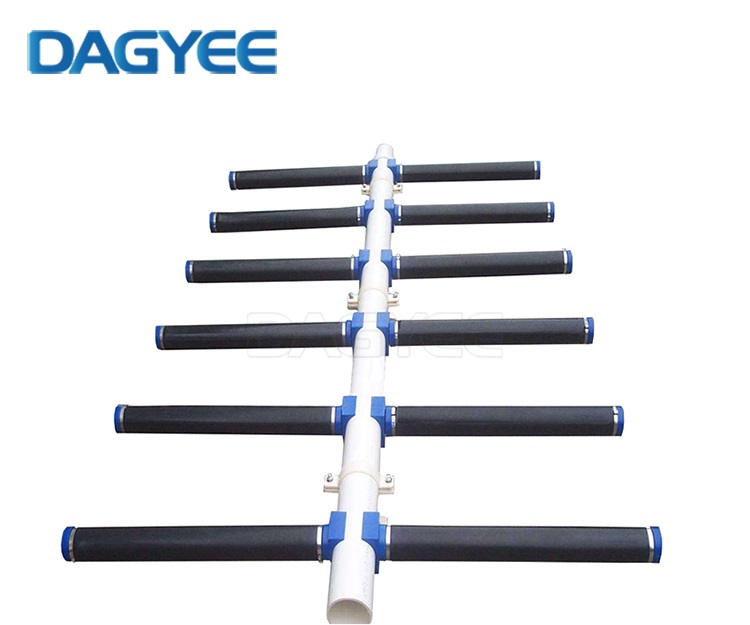
Fine-bubble aeration tubes, also widely known as tube diffusers, stand as indispensable core components within modern activated-sludge wastewater treatment infrastructure. Whether deployed in municipal sewage treatment facilities, industrial biochemical wastewater projects, or recirculating aquaculture systems, these tubular diffusers deliver uniform fine-bubble distribution to maximise gas-liquid contact area and boost standard oxygen-transfer efficiency (SOTE). Compared with coarse-bubble aeration equipment, well-maintained aeration tubes can cut blower power consumption significantly while maintaining stable biochemical degradation performance for organic pollutants and ammonia-nitrogen.
Nevertheless, continuous exposure to complex mixed liquor, cyclic air pressure fluctuation, chemical corrosion, temperature swings, and accumulated suspended solids gradually damages diffuser membranes over service time. Most field operators hold a common misconception: aeration tube breakdown happens overnight. Real-world operational data from thousands of wastewater sites demonstrates that complete aeration tube failure is almost always preceded by weeks or even months of observable warning signals. Ignoring these subtle pre-failure indicators brings cascading negative consequences: rising blower backpressure, soaring energy expenditure, uneven dissolved-oxygen distribution across aeration tanks, deteriorated effluent quality, and unplanned tank-draining downtime for component replacement.
Many existing technical documents and open-access research papers focus narrowly on a single failure mechanism such as mineral scaling or biofouling. Few practical guides systematically integrate on-site observable warning symptoms, multi-dimensional root-cause diagnosis, step-by-step troubleshooting workflows, cleaning constraints, and long-term preventive maintenance tailored for field operation-and-maintenance teams. This article draws upon open-source wastewater research findings and decades-long accumulated on-site engineering experience. It aims to offer plant managers, process engineers and maintenance technicians a complete, actionable reference for identifying early-stage aeration tube degradation, diagnosing different failure modes, implementing appropriate corrective actions, and establishing durable maintenance regimes to extend diffuser service cycles.
2. How Aeration Tube Failures Disrupt Overall Wastewater System Performance
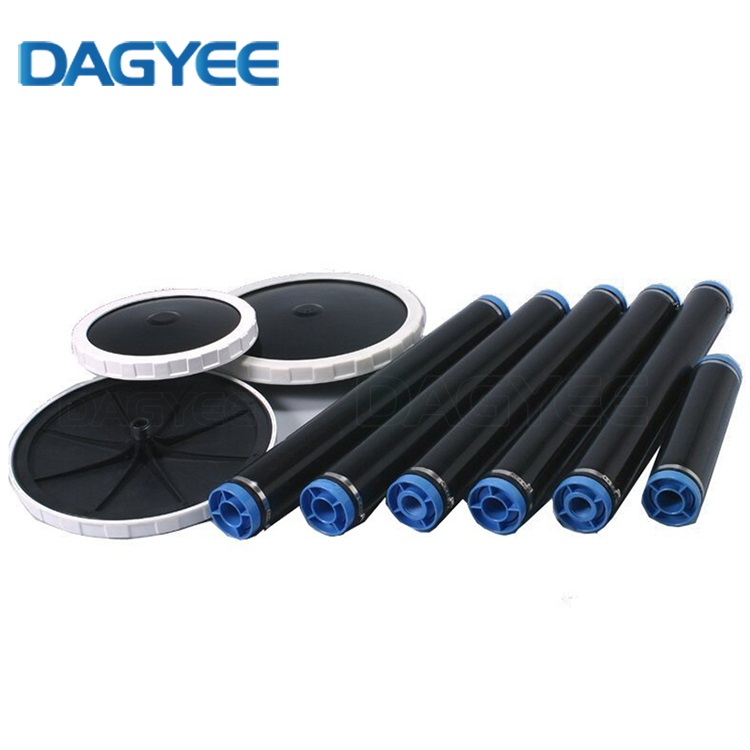
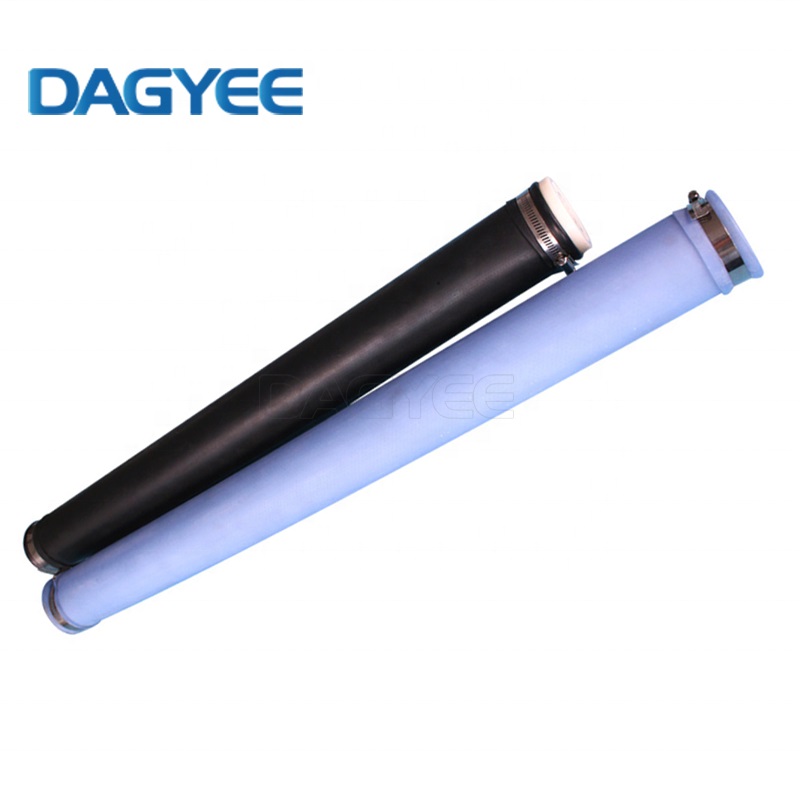
Before diving into warning identification and fault diagnosis, it is critical to understand how degraded aeration tubes propagate negative impacts across the whole aeration subsystem. Typical aeration tube membranes are manufactured from EPDM, modified silicone, thermoplastic PU or HDPE substrates. Under nominal working conditions, slit micropores open under air pressure to release fine bubbles ranging from 1 mm to 3 mm. Once fouling, ageing, cracking or joint leakage occurs, performance loss will not confine itself to individual tubes. Instead, negative effects spread throughout blowers, biochemical sludge activity and final effluent indicators.
First and foremost, energy consumption rises sharply. Pore clogging, biofilm accumulation and mineral scaling increase airflow resistance inside the aeration network. Blowers have to sustain higher discharge pressure to maintain target airflow volume. In practical engineering cases, heavily fouled aeration tubes can drive power consumption up by 20 %-40 %. Such extra energy overhead constitutes a major ongoing operational cost for medium-to-large-scale wastewater facilities.
Second, biochemical treatment stability collapses. Partial blockage or damaged membranes create low-dissolved-oxygen dead zones inside aeration basins. Inside these zones, heterotrophic bacteria cannot fully decompose organic pollutants. Nitrification processes for ammonia-nitrogen removal slow down obviously. Long-term local oxygen shortage easily triggers sludge bulking and sludge foaming events, further complicating sludge-water separation in secondary sedimentation tanks.
Third, secondary damage strikes upstream air-supply hardware. Persistent high backpressure places continuous mechanical stress on blower impellers, bearings and frequency-conversion modules. Frequent overload alarms reduce blower working lifespan and raise unexpected blower-failure risks. Sudden aeration tube rupture releases massive coarse bubbles, generating strong water-body turbulence that disturbs settled sludge layers and deteriorates sedimentation performance.
Fourth, unplanned maintenance brings heavy economic losses. Severe aeration tube damage usually requires tank draining, water body emptying, manual underwater inspection and component replacement. Downtime interrupts normal wastewater treatment workflows. Labour, component procurement and production-halt losses combined often greatly exceed the cost of regular preventive inspection.
A large share of wastewater plants only launch maintenance activities after aeration tubes lose most aeration capacity. Operators should bear in mind: early warning signals show up long before total functional loss. Operators can capture these risk hints via surface observation, equipment log data and water-quality trend monitoring.
3. Observable Early Warning Signs of Impending Aeration Tube Failure
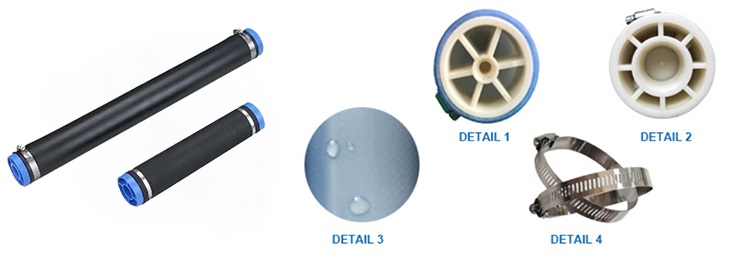
Pre-failure warning signals can be sorted into three practical categories: visual bubble phenomena on tank surfaces, abnormal parameter readings from supporting equipment, and degradation of wastewater treatment performance. Cross-referencing multiple groups of signals helps maintenance staff exclude interference from blower faults, valve mis-operation or inflow-load fluctuation.
3.1. Visual Warning Signals Observed from Tank Surface
Visual inspection is the most convenient on-site diagnostic method without additional testing instruments. Operators should carry out regular visual checks under stable blower operating parameters.
a) Non-uniform bubble distribution: Some aeration zones generate sparse fine bubbles while adjacent areas produce violent coarse-bubble surges. This phenomenon usually indicates partial pore blockage, local membrane micro-cracks or loosely-connected tube joints.
b) Periodic bubble intensity fluctuation: When blower airflow setting remains unchanged, bubble output surges and fades cyclically. This symptom hints partial pore blockage accompanied by intermittent sludge back-intrusion. When compressed air punches through blocked material temporarily, bubble output rises; sludge particles re-block slits and suppress bubble output afterwards.
c) Local zero-bubble phenomenon: Individual or several adjacent aeration tubes barely release bubbles, while surrounding diffuser assemblies work normally. It signals severe pore blockage or internal pipeline obstruction at branch-pipe outlets.
Abnormal persistent foam: Thick, sticky, dark-coloured foam accumulates stably above certain aeration sections. Biofouling layers on aeration tube surfaces reduce oxygen transfer efficiency, altering microbial community structures and aggravating foam formation.
It should be noted that short-term uneven bubble distribution may appear right after blower startup. Operators must judge warning risks only after the whole aeration system reaches stable operating status.
3.2 Instrument-Based Parameter Warning Indicators
Visual observation is subjective. Instrument monitoring data provides objective, quantifiable early-stage alarms. Facilities with automatic monitoring systems can build baseline comparison datasets with newly-installed aeration tube operating parameters.
a) Progressive rise of blower backpressure: Under fixed airflow rate, continuous month-on-month growth of blower discharge pressure serves as the most representative pre-clogging warning. When working backpressure exceeds original design threshold by 15 %-25 %, aeration tubes have entered the accelerated-fouling phase.
b) Large dissolved-oxygen deviation across tank sampling points: Operators increase blower frequency to lift overall DO value, yet local measuring points still maintain extremely low dissolved-oxygen readings. Such inconsistency reflects uneven aeration performance caused by partial aeration-tube degradation.
c) Frequent blower overload protection alarms: After eliminating blower mechanical failure, valve blockage and pipeline obstacle causes, repeated overload alarms strongly suggest rising system resistance triggered by aeration-tube fouling.
3.3 Wastewater Treatment Performance Warning Signals
When equipment and visual symptoms are not obvious, variations in effluent indicators can also reflect hidden aeration-tube degradation. Operators need to exclude interference from inlet-water load fluctuation.
a) Difficult-to-stabilise dissolved-oxygen concentration even after blower frequency adjustment.
b) Gradual rise of sludge volume index (SVI), higher risk of filamentous-bacteria-driven sludge bulking.
c) Unstable removal efficiency for COD and ammonia-nitrogen without obvious inflow-pollutant-load changes.
When two or more above-mentioned warning signals appear simultaneously, aeration-tube degradation has moved past mild status. Delaying maintenance work will result in irreversible membrane material damage.
4. Typical Aeration Tube Technical Specification Reference Table
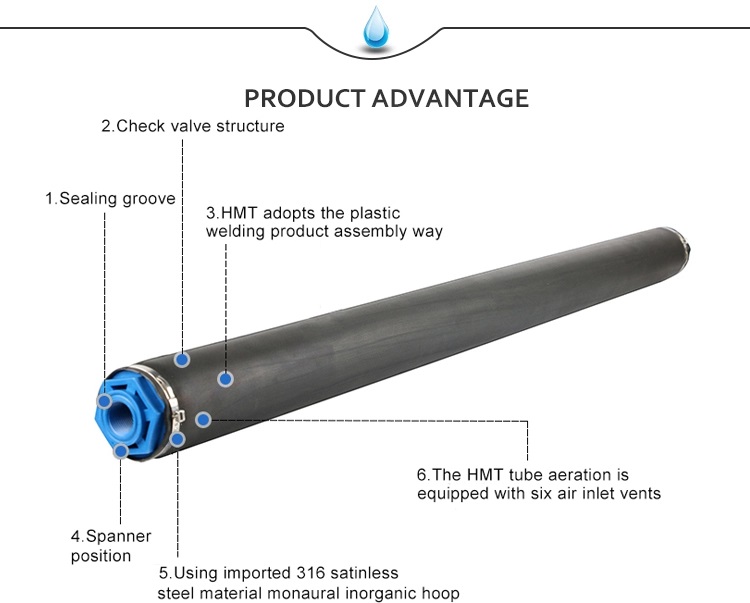
The table below lists mainstream technical parameters for commonly-used EPDM and silicone aeration tubes. Field engineers can compare real-site operating parameters against factory specifications to judge abnormal operating status.
| Parameter Item | EPDM Aeration Tube | Silicone Aeration Tube | Remarks |
|---|---|---|---|
| Typical membrane material | Modified EPDM rubber | High-temperature resistant silicone | PU material for special anti-oil wastewater |
| Usable tube diameter | 65 mm / 75 mm | 65 mm / 75 mm | Customised diameters available |
| Working temperature range | 5-60 °C | -10-80 °C | Silicone tolerates wider temperature fluctuation |
| Nominal working pressure | 0.02-0.05 MPa | 0.02-0.05 MPa | Excessive pressure accelerates membrane fatigue |
| Suggested airflow per unit | 3-8 m³/h per tube | 3-8 m³/h per tube | Excessive airflow causes bubble coarsening |
| SOTE (standard oxygen transfer efficiency) | 22-32 % | 24-34 % | Under standard test tank conditions |
| Expected service life | 3-5 years | 4-6 years | Subject to water quality & maintenance frequency |
| Main applicable scenario | General municipal sewage | High-hardness, high-temperature wastewater | Silicone delivers better anti-scaling performance |
Table 1: Mainstream aeration tube technical specification reference
5. Classification of Typical Aeration Tube Failures, Root-Cause Analysis and Troubleshooting Solutions
Different failure modes generate partially overlapping warning phenomena. Operators need to distinguish root causes before adopting disposal measures. Blind cleaning or random component replacement wastes labour and material resources.
5.1 Failure Mode 1: Pore Clogging and Surface Fouling (Highest-Occurrence Fault)
Pore clogging divides into three major categories: biological biofouling, mineral scaling deposition and solid-particle sediment clogging. Biofouling originates from microbial attachment onto aeration-tube outer surfaces. Microorganisms secrete extracellular polymeric substances (EPS), forming sticky biofilm layers. Suspended solids in mixed liquor adhere to such sticky layers and gradually seal micropore slits. This failure mode frequently occurs under high-organic-load wastewater conditions. Mineral scaling mainly consists of calcium carbonate, magnesium hydroxide and other salt precipitates. At the gas-liquid interface of aeration-tube slits, local pH value shifts accelerate crystal precipitation. Hard-water-quality wastewater sites face higher scaling risks. Solid-sediment clogging happens during aeration-system shutdown cycles. Without anti-backflow structural design, sludge, grit and pipeline rust fragments flow backwards into aeration-tube slits and inner chambers.
Warning signs: Month-by-month backpressure increase, reduced bubble density, dropping DO value, continuous growth of blower power consumption.
Troubleshooting and resolution measures:
a) Off-line mechanical cleaning: Drain the aeration tank and take out aeration-tube assemblies. Adopt soft-bristle brushes together with 0.4-0.6 MPa high-pressure water jets to wash surface biofilm and loose scaling. Operators must strictly avoid ultra-high water pressure, which will scratch and permanently damage rubber-membrane slits.
b) Chemical soaking treatment: For mineral scaling, soak disassembled aeration tubes within 4-5 % dilute hydrochloric acid solution for 8-12 hours, then rinse thoroughly with clean water. For organic biofouling, dilute alkaline detergent soaking works better. Operators must strictly control solution concentration and soaking duration; over-aggressive chemical treatment will accelerate rubber-membrane ageing and hardening.
c) On-line circulating chemical cleaning: Suitable for large-scale municipal plants avoiding long-time tank-shutdown. Inject low-corrosion cleaning agents through air pipelines for circulating cleaning without draining the whole tank. This method cannot remove heavy hard scaling completely, yet it effectively relieves mild-to-moderate fouling.
d) Reverse pulse high-pressure air blowing: Disconnect tube end connectors and apply 0.7-1.0 MPa pulse compressed-air reverse blowing to eject internal granular impurities. This method works well for loose particle-type clogging, but shows limited effect for dense mineral crystal scaling.
Critical practical note: Once mineral crystals embed deeply inside membrane slits, cleaning procedures cannot restore original aeration-tube performance. In such cases, component replacement becomes unavoidable.
5.2 Failure Mode 2: Membrane Ageing, Hardening and Loss of Elasticity
Root-cause factors include long-term cyclic pressure load, chemical corrosion from wastewater constituents, residual oxidant substances, and polymer-material plasticizer loss. After multi-year operation, EPDM membranes gradually lose elasticity and turn hard. Even under nominal working pressure, slit openings cannot expand normally, resulting in coarse-bubble output and obvious oxygen-transfer-efficiency decline.
Warning signs: No obvious scaling layer can be observed on tube surfaces, yet bubbles turn coarse. Cleaning work brings only limited performance improvement. Backpressure rises slowly but continuously.
Solutions: Age-hardened aeration-tube membranes cannot recover elasticity via cleaning. Operators need to replace the worn membrane sleeve or the whole aeration-tube assembly. When purchasing new diffuser components for reconstruction projects, select anti-ageing modified-EPDM or high-quality silicone materials to extend expected service cycles. In daily operation, avoid long-term over-pressure running to slow down polymer-material fatigue processes.
5.3 Failure Mode 3: Physical Damage: Cracks, Tears and Puncture Damage
Physical damage stems from multiple sources: improper installation operations, transient over-pressure impact, sharp-object scratches during construction, thermal stress, long-term sludge scouring abrasion, and over-tight hoop-clamp compression. Welding slag falling onto aeration-tube zones during tank renovation also easily causes puncture wounds.
Warning signs: Localised massive coarse-bubble surges; sharp pressure drop within partial aeration zones; prominent dissolved-oxygen difference between different tank sections.
Solutions: Carry out zone-isolated air-supply testing to accurately locate damaged aeration-tube units. Minor local tearing can be solved by partial-membrane-sleeve replacement. Large-area rupture requires complete aeration-tube assembly replacement. During subsequent installation and maintenance, standardise operating workflows: avoid forced distortion of membrane sleeves; control hoop-clamp tightening torque; take protective measures to prevent sharp construction residues from dropping onto aeration-tube layouts.
5.4 Failure Mode 4: Joint Leakage and Air-Channel Connection Faults
Root-causes include loosely-fastened hoop clamps, aged sealing gaskets, mismatched pipe-joint dimensions, poor-quality welding points, and corrosion of underlying support pipes. Many operators misjudge joint-leakage symptoms as aeration-tube-body damage, leading to unnecessary component replacement.
Warning signs: Visible air escaping from connector positions; abnormal bubble status of adjacent tubes; system-wide air-supply pressure cannot reach designed set-value.
Solutions: Shut down corresponding air-supply branch pipelines and inspect every connection point one-by-one. Replace aged sealing gaskets; retighten hoop clamps with appropriate torque values; replace heavily-corroded support pipes. Verify pipe-joint dimension matching and forbid forced assembly of mismatched connectors.
5.5 Failure Mode 5: Poor Aeration Uniformity Triggered by Air-Supply System Defects
This fault category does not originate from aeration-tube-body damage. Defects inside upstream air-supply pipelines create symptoms highly similar to aeration-tube failure. Root-causes cover unreasonable main-pipe and branch-pipe layout design, pipeline blockage by rust and oil-sediment, incompletely-opened control valves, and excessive local flow resistance.
Warning signs: Front-end aeration tubes produce strong bubble output, while tail-end tubes show weak aeration effect; overall pipeline pressure loss exceeds design-calculated value.
Solutions: Test pressure-difference values between air-pipe inlet points and branch-pipe terminal points. Conduct high-pressure reverse-blowing for air pipelines to clear internal rust and impurity deposits. Optimise pipeline layout, reduce sharp-bend-caused flow resistance. Install high-efficiency air filters at blower outlets to intercept oil mist and particulate contaminants before they enter aeration-tube networks.
6. Fault-Judgement Comparison Table for Common Aeration-Tube-Related Abnormalities
Maintenance technicians can refer to this table to quickly differentiate fault sources and avoid misdiagnosis.
| Abnormal Phenomenon | Most Probable Root-Cause | Primary Verification Action |
|---|---|---|
| Whole-system backpressure rises, all tubes bubble weaken | Universal aeration-tube fouling / blower filter blockage | Compare historical pressure baseline; inspect blower filter cartridge |
| Only individual tube coarse-bubble output, overall pressure stable | Local membrane crack / puncture | Isolate air-supply branch for visual inspection |
| Joint position air escaping, total pressure cannot reach target | Hoop loose / sealing gasket ageing | Shut-off branch pipeline, inspect each connector |
| Front-tubes bubble strong, rear-tubes bubble weak | Air-supply pipeline resistance imbalance | Measure pressure difference between pipeline inlet and terminal |
| Cleaning brings only short-term performance improvement | Membrane material ageing | Check membrane hardness and elasticity status |
Table 2: Quick-judgement comparison table for aeration-tube-related abnormal phenomena
7. Preventive Maintenance Checklist & Schedule Reference Table
Proactive preventive maintenance delivers far better economic benefits than post-failure emergency repair. The table below provides practical inspection-and-maintenance frequency suggestions according to different water-quality conditions.
| Maintenance Item | General Municipal Sewage | High-Hardness Scaling-Prone Wastewater | High-Organic-Load Industrial Wastewater |
|---|---|---|---|
| Weekly data record (blower pressure, DO) | Weekly | Weekly | Weekly |
| Surface visual bubble inspection | Every 2 months | Every 1 month | Every 1 month |
| Partial on-line inspection & simple cleaning | 6-12 months | 4-6 months | 4-6 months |
| Off-line comprehensive cleaning work | 2-3 years | 1-1.5 years | 1-1.5 years |
| Overall aeration-tube performance evaluation | Every 3 years | Every 2 years | Every 2 years |
Table 3: Preventive maintenance schedule reference for aeration tubes
Combined with the schedule table, several core preventive-maintenance principles deserve emphasis:
a) Establish baseline-data archives: After new aeration-tube installation, record blower working pressure, DO distribution and energy-consumption data as benchmark reference. Subsequent inspection data compares against this baseline to spot slow degradation trends that cannot be identified via naked-eye observation.
b) Optimise air-source pretreatment: Install multi-stage high-efficiency filters at blower outlets to intercept oil mist, dust and condensed-water impurities. Prevent pollutants from entering aeration-tube micropores together with compressed air.
c) Optimise operating-mode logic: Avoid long-term ultra-low-air-volume operation. Reduce frequent blower start-stop cycles as much as possible. Frequent start-stop operations create negative-pressure moments and induce sludge back-intrusion into aeration-tube slits.
d) Match material selection with actual water-quality conditions: For high-hardness scaling-prone wastewater, give priority to silicone aeration tubes with superior anti-scaling characteristics. For high-organic-pollutant industrial wastewater, select material formulations optimised for anti-biofouling performance.
e) Standardise installation-site construction: Guarantee horizontal installation precision of aeration-tube support frames to ensure uniform stress distribution across diffuser sleeves. Prevent mechanical extrusion damage during installation.
8. Practical On-site Troubleshooting Workflow for Maintenance Engineers
When multiple warning signals emerge, maintenance teams can follow this step-by-step workflow to complete fault diagnosis and disposal:
a) Collect multi-dimensional historical operating data: record blower pressure, real-time airflow rate, multi-point dissolved-oxygen data, aeration-tube cumulative running time and recent inflow-water-quality fluctuation. Exclude abnormal conditions caused by inlet-water-load mutation.
b) Carry out multi-position visual observation: Evaluate bubble uniformity, locate coarse-bubble zones and zero-bubble zones. Observe whether air leakage exists at joint positions.
c) Source-distinguishing diagnosis: Confirm whether faults originate from aeration-tube-body failure or upstream air-supply pipeline system defects. Use branch-valve isolation testing to narrow down fault scope.
d) Select corresponding disposal scheme: Choose between on-line chemical cleaning, off-line physical-chemical combined cleaning, partial-membrane-sleeve replacement or full-assembly replacement according to fault severity.
e) Post-maintenance effect verification: Compare blower backpressure, bubble distribution and multi-point dissolved-oxygen indicators before and after maintenance work, to evaluate whether corrective actions achieve expected effect.
f) Archive maintenance records: Record fault type, disposal measures and component-replacement information. Adjust subsequent inspection-and-maintenance cycle according to actual site conditions.
9. Frequently Asked Questions
Q1: Can heavy-scaled aeration tubes always recover full performance after chemical cleaning?
A: No. If mineral crystals embed deep inside membrane slits and produce permanent slit deformation, cleaning cannot restore original aeration performance. In such scenarios, replacement represents the only viable solution. Operators should avoid over-expectations for chemical-cleaning effects.
Q2: Is higher blower pressure equal to aeration-tube clogging?
A: Not exactly. Blower-filter blockage, pipeline obstruction and valve-opening adjustment will also raise system pressure. Operators need to combine multi-point DO data and bubble-distribution observation to make comprehensive judgements.
Q3: How to reduce back-flow-caused clogging during system shutdown?
A: Install anti-backflow valves on air-supply branch pipelines. Minimise frequent short-cycle blower start-stop operations. For long-time shutdown scenarios, maintain small-volume continuous air supply to avoid negative-pressure sludge back-intrusion.
10. Conclusion
Aeration tube failure rarely happens without premonition. Abnormal bubble behaviour on tank surfaces, continuous blower-backpressure growth and uneven dissolved-oxygen distribution serve as reliable early-warning indicators for diffuser degradation. Pore fouling and clogging, membrane ageing-hardening, physical tearing damage and joint-connection leakage constitute four dominant failure modes. Each failure mode corresponds to targeted cleaning, repairing or replacement solutions.
Effective aeration-tube management does not merely focus on emergency troubleshooting after faults occur. More importantly, plant teams need to capture early-stage degradation signals, implement scientific preventive-maintenance schedules, and select suitable membrane materials matching on-site water-quality characteristics. Such comprehensive measures maximise aeration-tube service life, stabilise biochemical-treatment efficiency, and lower overall operating expenditure for the whole wastewater aeration system.
Consistent routine monitoring and timely intervention can help wastewater facilities avoid unplanned downtime and unnecessary component-replacement costs, supporting long-term stable operation of biochemical treatment units.

Name: Ashely Li
Mobile:+8613961861780
Tel:+8613961861780
Whatsapp:8613961861780
Email:info@dagyee.com
Add:Room 302, Building 11-4, Hongyi Road, Xinan Town, Xinwu District, jiangsu Province, China