 English
 Chinese
info@dagyee.com
+8613961861780

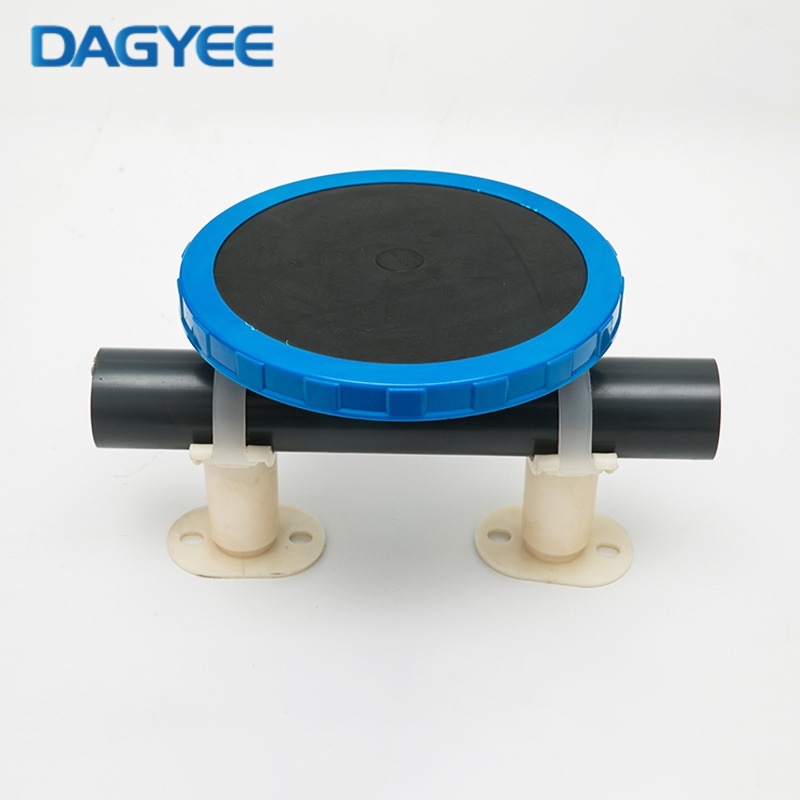
Within biochemical wastewater treatment processes, fine-bubble aeration discs stand as one of the most capital-intensive and operation-critical components inside activated sludge basins. Municipal wastewater facilities, industrial effluent treatment sites and even large-scale aquaculture systems rely heavily on these membrane-based diffusers to deliver stable dissolved-oxygen supply for nitrification, organic-matter degradation and sludge-suspension mixing.
Compared with traditional coarse-bubble perforated pipe aeration, modern aeration disc units deliver far higher oxygen transfer efficiency, reduced blower power draw and flexible layout adaptability for both new-build and retrofitted tanks.
Even with well-specified hardware, field operators frequently face unexpected performance drops that trace back to aeration disc degradation. Most site teams only respond after observing deteriorated effluent quality, elevated ammonia-nitrogen discharge, frequent blower overload alarms or obvious anaerobic odors rising from tank surfaces. By the time visible symptoms appear, irreversible membrane damage may already have taken place, forcing unplanned tank drainage, costly component replacement and potential compliance risks for discharge permits.
Many real-world failures do not stem purely from manufacturing defects. Improper material matching, installation shortcuts, fluctuating influent water quality, unsuitable operating modes and neglected routine maintenance combine to shorten service life and trigger gradual performance decay. Recognizing early warning signals, conducting structured fault diagnosis and executing standardized maintenance work can effectively extend membrane service cycles, stabilize biological treatment performance and bring measurable energy-saving benefits for the whole aeration system.
This article draws on real-world wastewater site observations and published field research to outline practical warning indicators, break down typical failure modes, provide step-by-step troubleshooting logic and build actionable maintenance schedules for plant engineers and project designers. It also covers frequently repeated engineering mistakes that accelerate aeration disc premature failure.
1. Early Warning Indicators of Impending Aeration Disc Failure
Aeration disc malfunction rarely occurs overnight. Observable and measurable warning signs emerge weeks or months before complete functional loss. Operators need to cross-reference instrument readings with on-tank visual inspection to filter false alarms caused by sensor drift or instrument calibration deviation. Reliance on only one single indicator often leads to misjudgment and delayed intervention.
1.1 Gradual rising blower header pressure
Under stable submerged depth and fixed airflow setpoints, a continuous upward shift in blower outlet pressure serves as one of the most reliable early-stage warning markers. When new and clean, aeration discs hold a stable baseline pressure value. If operating conditions remain unchanged yet header pressure climbs 10 % to 20 % above the original baseline, membrane micropores are becoming blocked by inorganic scaling or accumulated biological slime. Rising system resistance drives higher blower current output without any manual adjustment on control panels. If pressure keeps climbing beyond equipment design limits, blowers risk frequent overload shutdown and unexpected system downtime.
Best practice recommends recording clean-condition baseline pressure values during commissioning. A maintenance trigger point should be set when measured pressure increases by 15 % relative to the baseline reference.
1.2 Dissolved-oxygen distribution imbalance and low DO output
Plant operators commonly encounter this confusing scenario: blower output is manually increased, yet target dissolved-oxygen setpoints cannot be achieved. Wide DO gaps form across different zones inside the aeration tank, with certain sections persistently staying below 0.5 mg/L even under elevated air supply. Many site technicians simply crank up airflow volume, consuming extra electricity without solving the underlying diffuser-related problem.
Uneven DO distribution signals partial diffuser fouling, local membrane damage or blocked branch air pipelines. Real oxygen transfer efficiency drops while superficial air flow remains high. Before concluding aeration disc failure, field crews must calibrate DO sensors, clean probe membranes and eliminate instrument reading deviation, as faulty sensors create identical misleading symptoms.
1.3 Visible bubble pattern abnormalities
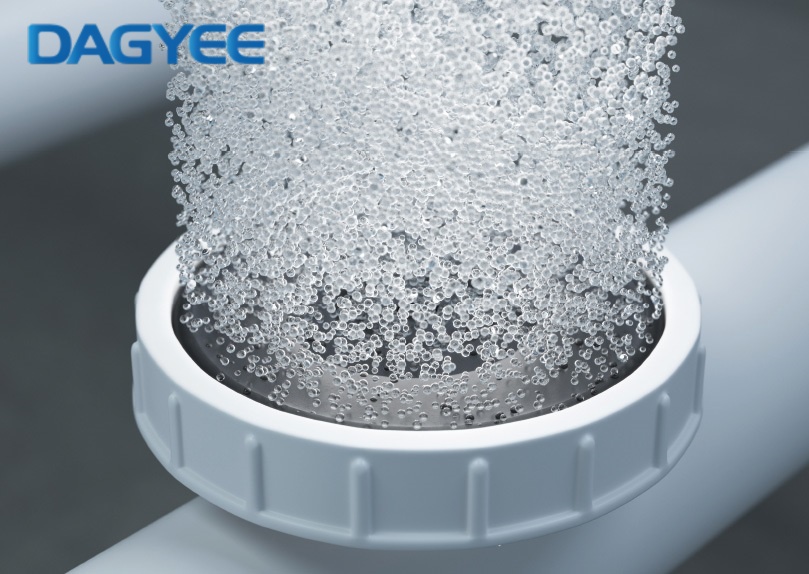
Visual observation over aeration tank surfaces delivers straightforward on-site diagnostic clues. Normally operating aeration discs produce a uniform carpet of fine bubbles across the basin floor. When hardware problems develop, bubble behaviour changes noticeably:
a) Concentrated coarse large-bubble surging in localized spots, accompanied by distinct air-leaking noise;
b) Patchy dead zones with almost no bubble generation next to heavily bubbling sections;
c) Individual disc units bulge prominently once air supply stops and fail to retract rapidly.
These patterns point toward membrane tearing, gasket seal failure, fastener loosening or internal check-valve malfunction. Once one-way check-valves lose sealing capability, sludge can flow backward into air distribution pipelines and trigger cascading blockage across multiple downstream diffuser units.
1.4 Secondary process-level warning signals
Beyond direct aeration-system readings, wastewater process performance itself offers indirect failure alerts. Declined ammonia-nitrogen removal efficiency, periodic hydrogen-sulfide odour emissions and settled sludge accumulation at tank bottom zones all suggest local anaerobic environments created by insufficient oxygen supply. Nitrifying bacteria lose metabolic activity under low-DO conditions, resulting in unstable effluent quality even when biochemical tank MLSS levels remain within design ranges.
2. Technical Specification Reference Table for Typical Fine-Bubble Aera
This parameter table covers widely-used standard-size aeration disc hardware for municipal and general industrial wastewater projects. Actual figures will shift according to manufacturer formula, material selection and custom-ordered dimensions.
| Item | Standard Specification | Remarks |
|---|---|---|
| Disc outer diameter | 215 mm / 260 mm | 215 mm is most common for retrofitting projects |
| Membrane material | EPDM / Silicone / PTFE-coated elastomer | EPDM: municipal sewage; Silicone: oily & high-temperature wastewater; PTFE coating: strong chemical corrosion resistance |
| Recommended operating airflow per disc | 2.0-6.0 m³/h | Avoid long-term operation below minimum airflow rating |
| Initial pressure loss (clean membrane) | 180-280 mbar | Measured under intermediate design airflow rate |
| Maximum allowable working temperature | 60 °C | EPDM version limited to 50 °C continuously |
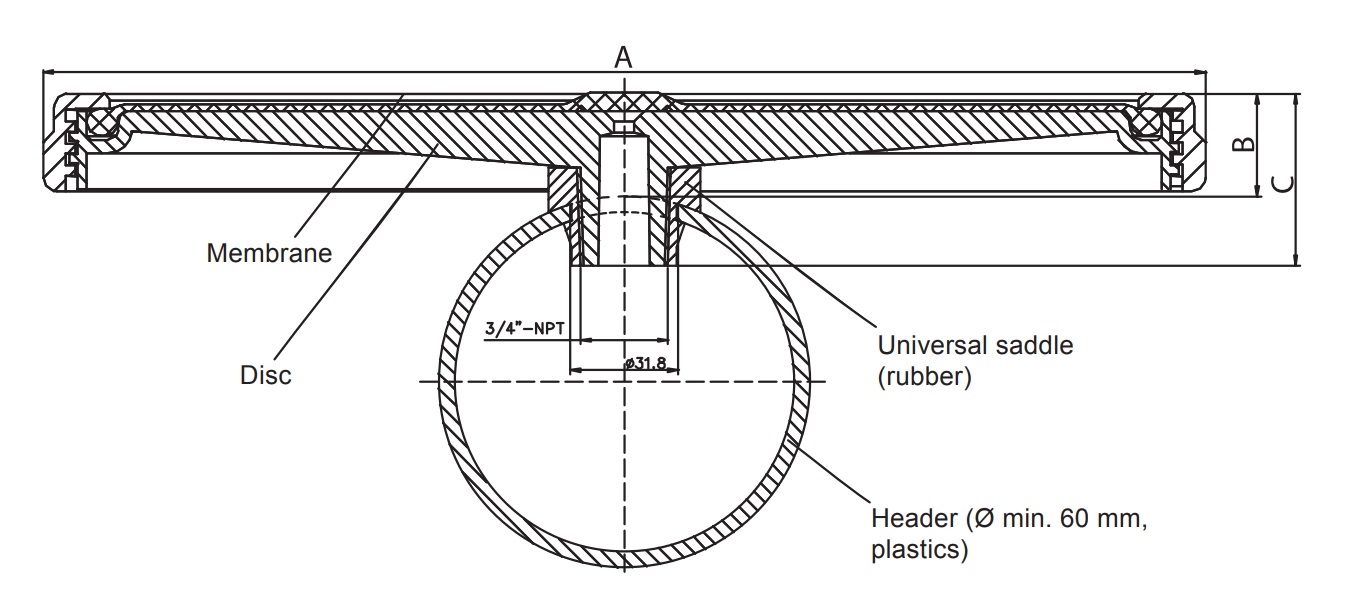
| Supporting base material | Reinforced ABS / Stainless-steel 304 | Stainless-steel base preferred for corrosive industrial wastewater |
| Built-in check-valve | Integrated rubber one-way valve | Prevents sludge backflow upon blower shutdown |
| Design service life (municipal condition) | 3-5 years | Industrial wastewater service life highly water-quality dependent |
| Oxygen transfer efficiency (OTE) | 25-35 % under standard test conditions | Real-site OTE decreases as fouling accumulates |
Table 1: Typical aeration disc technical parameters for engineering reference
3. Six Primary Aeration Disc Failure Modes: Phenomena, Root Causes and Practical Solutions
Each failure mode presents distinguishable field symptoms. Correctly identifying root causes prevents repeated breakdowns after simple part replacement.
3.1 Membrane micropore clogging and fouling (most frequent field failure)
Fouling divides into inorganic scaling and biological biofouling, and the two often appear together on real-site diffuser surfaces. Calcium-carbonate and magnesium-salt crystalline scaling frequently occurs in influent with high water hardness. When total hardness exceeds 200 mg/L calculated as CaCO₃, crystal precipitation speeds up noticeably on elastomer membrane surfaces. Biological fouling forms when biofilm, sludge colloids and organic adhesive substances cover slit openings on aeration disc membranes.
Clogging manifests as rising blower back-pressure, reduced bubble density, coarsened bubble size and obvious OTE decline. Even with unchanged blower operation parameters, dissolved-oxygen levels drift downward over weeks.
Root causes cover multiple dimensions: high-hardness incoming water without softening pretreatment; sustained low-air-volume operation encouraging biofilm attachment; damaged blower intake filters letting dust and particulate contaminants travel through air pipelines into diffuser slits; prolonged system shutdown without anti-backflow protection allowing sludge intrusion into membrane gaps.
Solutions should match fouling severity. For light-level clogging, adopt periodic air bump cleaning. Operate short-duration high-impact airflow for 3-5 minutes every one to two months to shake loose surface-attached sludge deposits. Moderate inorganic scaling responds to online pickling: inject diluted 3-5 % hydrochloric-acid solution through aeration pipelines, maintain soaking duration for 30-60 minutes, then flush thoroughly using clean compressed air and water. Operators must strictly follow chemical-handling safety protocols during pickling procedures. For heavy combined organic-inorganic fouling, drain the aeration tank completely, remove disc assemblies and combine physical brushing with chemical soaking treatment. If pressure loss and oxygen-transfer performance cannot recover after thorough cleaning, membrane replacement becomes necessary.
Preventive countermeasures include scheduled inspection and replacement of blower air-intake filter cartridges. High-hard-water sites need pre-defined pickling cycles ranging from three to six months according to on-site water-quality monitoring data. System operators should avoid long-term running below each aeration disc’s minimum rated airflow value.
3.2 Membrane cracking, tearing and aging-related damage
Torn or cracked aeration-disc membranes produce local violent large-bubble leakage and audible escaping-air noise. Fine-bubble generation stops at damaged points, and oxygen transfer drops sharply within those localized zones.
Natural material aging represents one major contributing factor. EPDM and silicone elastomers gradually lose elasticity under long-term sewage immersion, microbial erosion and oxidative stress. Micro-cracks slowly expand across membrane surfaces over operating cycles. Chemical corrosion from industrial wastewater containing oils, solvents, heavy-metal ions or strong oxidants accelerates material degradation dramatically. Wrong material selection creates premature failure: deploying standard EPDM membranes inside oily solvent-bearing industrial wastewater can trigger widespread damage within only several weeks.
Mechanical damage sources include sharp gravel and metal fragments left inside tanks during construction phases that scratch membrane surfaces. Excessive tightening torque applied during installation introduces built-in stress that evolves into operational cracking. UV light exposure during outdoor storage creates invisible micro-cracks before installation even finishes. Repeated blower start-stop cycles subject elastomer membranes to continuous stretching-compression fatigue and expand existing micro-cracks.
Repair steps require tank drainage to locate damaged disc units. Install replacement membranes matching original material specifications. Simultaneously inspect supporting bases, sealing gaskets and clamping hoops; replace deformed or aged supporting accessories rather than only swapping membranes. For whole-zone large-scale damage events, re-evaluate material compatibility with actual wastewater composition and upgrade to silicone or PTFE-coated membranes for special industrial-effluent conditions.
Preventive suggestions: select membrane materials aligned with real-world wastewater components; avoid long-term sunlight exposure for unpacked diffuser components; keep operating pressure within manufacturer-published rated ranges; minimise unnecessary frequent emergency start-stop cycles; clear hard sharp debris before commissioning newly-built aeration basins.
3.3 Non-uniform aeration distribution across tank zones
Uneven aeration shows as dense bubbling in some areas while adjacent zones remain static and develop sludge sedimentation dead zones. Dissolved-oxygen readings vary drastically from basin section to section, and anaerobic pockets emerge at tank bottom.
Root causes cover installation quality, pipeline blockage and fitting failure. Exceeding allowable horizontal installation deviation (over ±5 mm) for aeration-disc bases distributes mechanical stress unevenly across membranes and breaks uniform air outlet behaviour. Welding slag, construction debris and solid particles get trapped inside branch air-supply pipelines and block partial air flow. Improper valve opening positions, blower capacity mismatch, ageing gaskets at disc-base joints and loosened fastening hoops also create aeration imbalance.
Troubleshooting workflow requires system shutdown and tank draining. Check installation flatness of aeration discs and air distribution pipes, adjust horizontal alignment to keep deviation within ±5 mm tolerance. Isolate individual air-supply branches and flush blocked pipelines by compressed-air purging or high-pressure water jetting. Inspect gasket seals and clamping hardware; swap out aged sealing components. Cross-verify blower performance parameters and regulating-valve opening settings.
3.4 Aeration disc loosening and detachment from base saddle
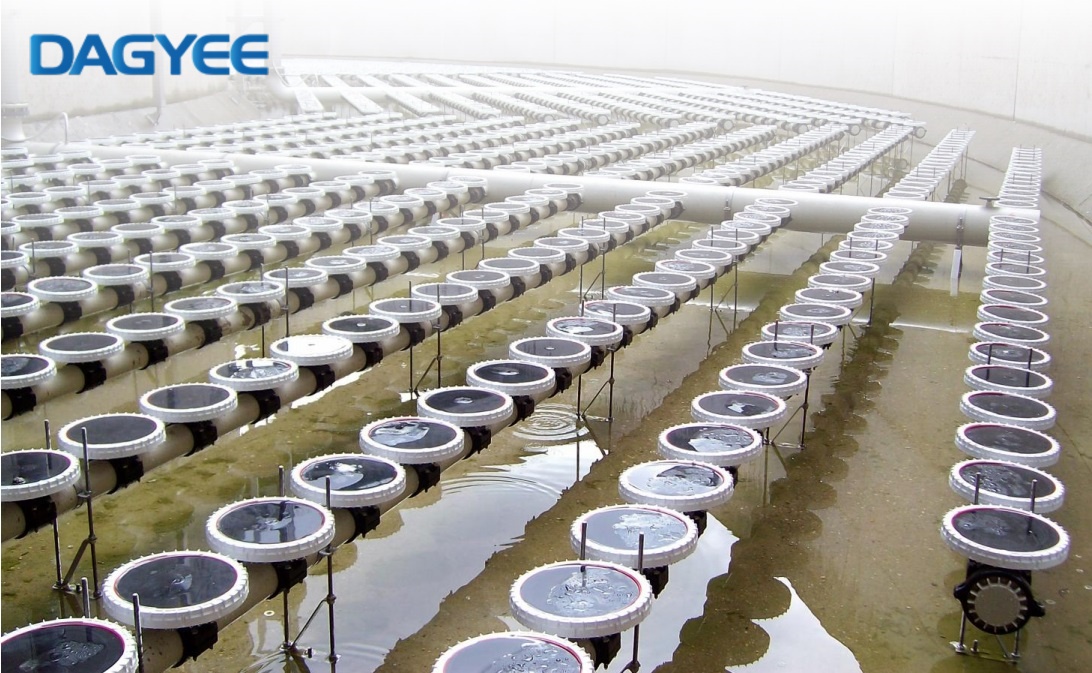
When aeration discs break loose from supporting saddles, massive air leakage occurs at connection points. Fallen disc assemblies may collide with underwater mixing equipment or block pipeline sections and bring secondary mechanical damage risks.
Corroded clamping hoops and bolts after long-term underwater immersion lose fastening force. Insufficient tightening torque during assembly represents a very common installation-related fault. Low-quality plastic supporting bases deform under continuous water-immersion load. Strong water-flow shear and sustained aeration-induced vibration gradually loosen fastener connections over operating months.
Resolution: reinstall loose aeration discs using corrosion-resistant stainless-steel fasteners and fasten according to manufacturer-specified torque values. Replace deformed supporting bases with reinforced ABS or stainless-steel alternatives. Adjust aeration intensity settings to reduce long-term excessive airflow-generated hydrodynamic impact.
3.5 Built-in check-valve failure and sludge back-flow
Once blowers shut down, sludge flows backward into aeration-disc inner cavities and air-supply pipelines. After restarting the aeration system, large numbers of diffuser units produce weak or zero air output due to internal blockage.
Integrated rubber check-valve components either age and lose elasticity or become stuck by granular sludge particles. When air-supply pressure disappears, valves cannot achieve complete sealing and permit reverse water and sludge entry.
Repair work includes disassembling aeration-disc assemblies to clean check-valve internals. If rubber valve parts show ageing or permanent deformation, full disc-unit replacement becomes necessary. For extended-duration plant standby conditions, avoid maintaining full water-level status; adopt targeted drainage protection measures.
3.6 Premature performance loss caused by improper material selection
Brand-new aeration discs lose elasticity within far shorter time frames than design service-life expectations, and widespread functional failure appears unexpectedly. This failure pattern almost always traces back to material-wastewater incompatibility. Standard EPDM does not resist solvents, mineral oils or strong oxidizing agents. General-grade silicone shows poor abrasion performance under high-suspended-solid sewage conditions.
For special industrial-wastewater projects, carry out small-sample immersion compatibility tests before large-volume procurement. Re-examine full-set influent water-quality indexes and re-specify membrane material grades accordingly.
4. Structured On-Site Troubleshooting Decision Table
Following this step-by-step diagnostic logic helps field engineers avoid blind disassembly and unnecessary component replacement.
| Observed Field Symptom | Most Probable Root Cause | Recommended First-Step Action |
|---|---|---|
| Whole-tank rising blower pressure + coarsened bubbles | Universal membrane fouling / scaling | Verify instrument baseline; perform air bump cleaning; evaluate pickling necessity |
| Local spots with large-bubble surging & noise | Membrane tear / gasket leakage / loose clamp | Drain partial tank section; inspect damaged disc units directly |
| Large-area regional zero-bubbling, rest of tank works normally | Branch pipeline blockage / valve malfunction | Isolate relevant air branch; purge pipeline with compressed air |
| Uneven DO across tank, partial bottom sludge settling | Installation flatness deviation / partial clogging | Check pipe & disc installation level; inspect sealing gaskets |
| After long shutdown, many discs fail to output air | Check-valve failure & sludge back-flow | Disassemble discs; clean or replace check-valve components |
| New discs degrade rapidly within months | Material incompatible with wastewater | Complete water-quality analysis; run lab immersion material test |
Table 2: On-site aeration disc troubleshooting decision reference
Work sequence for practical diagnosis:
1.Calibrate DO sensors, pressure transmitters and blower current sensors to rule out instrument false alarms;
2.Pull historical operating records, collect baseline pressure, airflow, current and multi-zone DO distribution data;
3.Conduct surface visual inspection, map dead-zone locations and leakage points, classify failure scope (local point, partial zone or full-tank performance decay);
4.Match observed symptoms against troubleshooting decision table for preliminary root-cause judgement;
5.Implement partial-zone drainage and physical inspection of aeration-disc hardware;
6.Deploy corresponding countermeasures: bump cleaning, chemical pickling, accessory replacement or full-membrane swap;
7.Restore aeration-system operation, re-test pressure, bubble behaviour and DO distribution to validate repair effectiveness.
5. Preventive Maintenance Schedule Table
Regular predictive maintenance slows performance degradation and avoids unplanned emergency repair events. The below schedule serves as practical guidance; actual frequency shall adjust for water-quality hardness, industrial-wastewater corrosiveness and site-specific operating conditions.
| Maintenance Frequency | Inspection & Maintenance Content | Acceptance Criterion |
|---|---|---|
| Weekly | Visual check of tank-surface bubble pattern; record blower pressure, current and multi-point DO readings | No continuous large-bubble leakage; pressure fluctuation remains under 10% |
| Quarterly | Pressure-difference comparison against clean baseline; inspect blower intake filter; execute air-bump cleaning | Pressure rise ≤10% compared with reference baseline; filter element free of heavy blockage |
| Every 3-6 months | Assess fouling accumulation status; perform chemical pickling for high-hard-water sites as required | Post-cleaning back-pressure returns close to original baseline value |
| Biannual-annual (tank drainage opportunity) | Physical inspection of aeration discs; check membrane elasticity, surface cracking, fastener tightness and gasket ageing; inspect branch pipelines | No large-area membrane cracking; fasteners intact; pipeline interior free of heavy deposits |
| Upon performance loss | Replace membranes when cleaning cannot restore OTE and pressure-loss indicators | Aeration performance meets original design specifications |
Table 3: Preventive maintenance schedule for aeration disc systems
Under typical municipal sewage conditions, EPDM aeration discs achieve 3-5-year service life with proper maintenance. Industrial wastewater installations see highly variable service life depending on water-quality corrosion intensity.
6. Common Costly Engineering Missteps in Real-World Projects
Many avoidable aeration-disc failures originate from habitual wrong operating and maintenance practices.
First, operators frequently compensate low dissolved-oxygen readings by simply increasing blower airflow. Once membranes become clogged, fine-bubble generation capability drops fundamentally. Higher air volume only wastes electrical energy instead of lifting real oxygen-transfer efficiency. This practice accelerates membrane fatigue and amplifies overall plant power consumption.
Second, over-tightening clamping hoops during installation creates pre-stress inside membrane material. Under cyclic aeration stretching, pre-loaded stress points easily develop into cracks after several months of runtime. Installation teams should strictly follow torque specifications rather than tightening hoops as hard as possible.
Third, ignoring blower air-intake filter maintenance lets dust and atmospheric particulates flow into diffuser slits, accelerating micropore blockage and shortening membrane service life significantly. Filter element replacement is low-cost yet delivers large long-term benefits.
Fourth, applying identical aeration-disc material specifications across all water-quality scenarios remains a widespread mistake. Municipal-grade EPDM membranes cannot withstand oily, solvent-rich or strongly oxidizing industrial effluents. One-size-fits-all procurement decisions produce premature large-scale failure in industrial-wastewater treatment sites.
Fifth, many facilities adopt purely reactive maintenance modes. They only launch repair work after water-quality violations or obvious equipment breakdown, without tracking long-term pressure-difference trend curves. Early-stage warning signals get overlooked until damage becomes irreversible.
7. Conclusion
Aeration disc failures rarely result purely from manufacturing defects. Most on-site performance decay emerges from combined influences of material-water-quality matching, installation precision, daily operating strategies and maintenance execution. Plant teams cannot wait until severe visible damage occurs before taking action.
Building an early-warning mechanism built on pressure-difference trending, multi-point dissolved-oxygen monitoring and regular bubble-pattern observation helps catch degradation at an intervenable stage. Structured fault diagnosis prevents random part-swapping that does not address root-cause issues. Reasonable cleaning cycles, correct material selection and standardized installation collectively stabilise aeration-system output, preserve oxygen-transfer performance and cut long-term operational expenditure for wastewater-treatment assets.
Retrofit projects and new-build designs both benefit from learning accumulated field-failure experience. When selecting aeration-disc hardware, project engineers should combine laboratory-published data with real-site historical case references rather than only comparing nominal technical-sheet parameters.
If your wastewater project faces aeration-disc selection, retrofit planning or on-site fault-diagnosis challenges, our engineering team can provide customised technical support tailored toward your actual influent-water-quality and tank-operating conditions.
Name: Ashely Li
Mobile:+8613961861780
Tel:+8613961861780
Whatsapp:8613961861780
Email:info@dagyee.com
Add:Room 302, Building 11-4, Hongyi Road, Xinan Town, Xinwu District, jiangsu Province, China